ProLint carries out protein-lipid contact analysis and visualization. This
section outlines how to use ProLint for visualizing contact information.
In addition to the information provided here, each application also displays its own documentation when you use it.
For instance, if you view the network graph representation of the interactions between Smoothened and its lipid environment
(see here
), you will see the documentation provided around the app.
This is the case for all apps suported by ProLint.
In contrast to analysis, data visualization is more variable and different users will have different preferences for how to best display results. From single lipid interactions with membrane proteins, to bulk effects of lipids, to overall physical changes to the structure of the membrane, users will have quite different interest in the lipid interaction profile of proteins. As such, ProLint does not confine visualization to one or two graphical elements. Instead, the main objective is to allow users to quickly and without hassle obtain valuable insight on protein-lipid contact details in their simulated systems. It does this by providing several default applications each distinct in its objective. Different applications are intended to be used for different usecases. In the following text, we provide a brief summary of each of these application. More details are provided when viewing the apps themselves.
Please note that for the calculated contact metrics, the unit of measurement is microseconds!
A distribution of data points
A quick but insightful method to visualize lipid-protein interactions is by using a scatter (or point) plot that shows each contact as a dot. ProLint allows you to change the measuring metric (the parameter used to measure the 'importance' of contacts) and to filter contacts based on several different criteria (e.g. the lipid species, residue type, etc.).
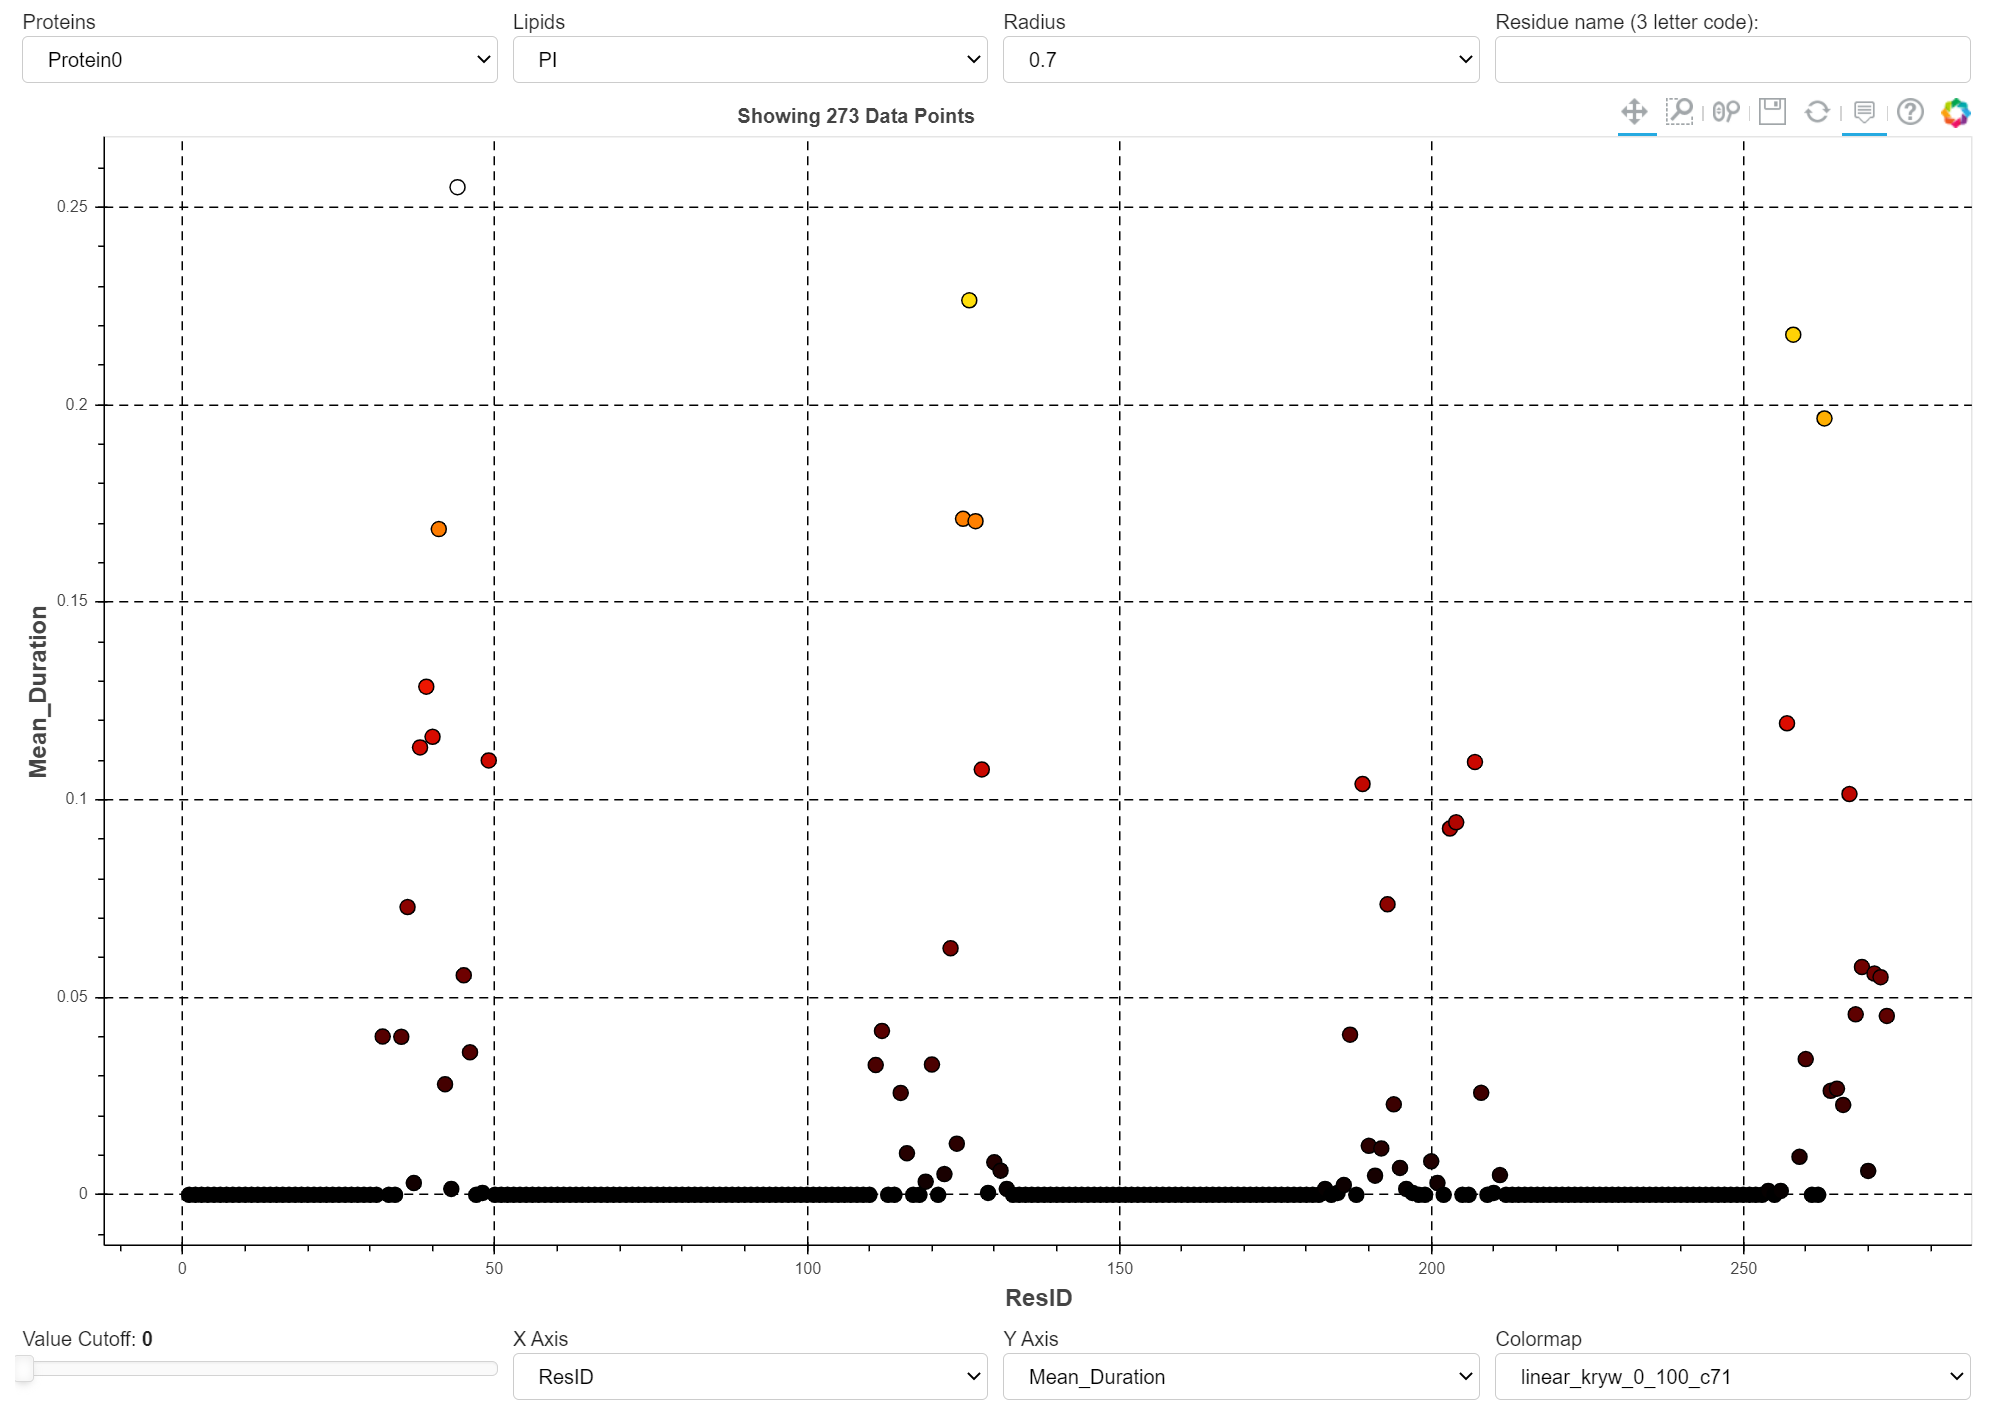
The image above shows a snapshot of the app. To show how this app is used to display interactions of many different lipid species (grouped according to their headgroup type) with 28 different GPCRs, click here.
Several interactive tools are provided to visualize different aspects of protein interactions with all lipid in the system. When more than one cutoff radius is used, you can filter based on that value. A slider functionally allows for tweaking the displaying of individual data points based on their parameter value. Another way to filter the data is by specifying the amino-acid three letter code (e.g. arg, leu, tyr). The parameters are plotted based on their measurement metric for each residue.
3D Viewer
NGL Viewer based application to visualize contact metrics as contact heatmaps that are projected on the surface of the protein. You visualize it in ProLint using::
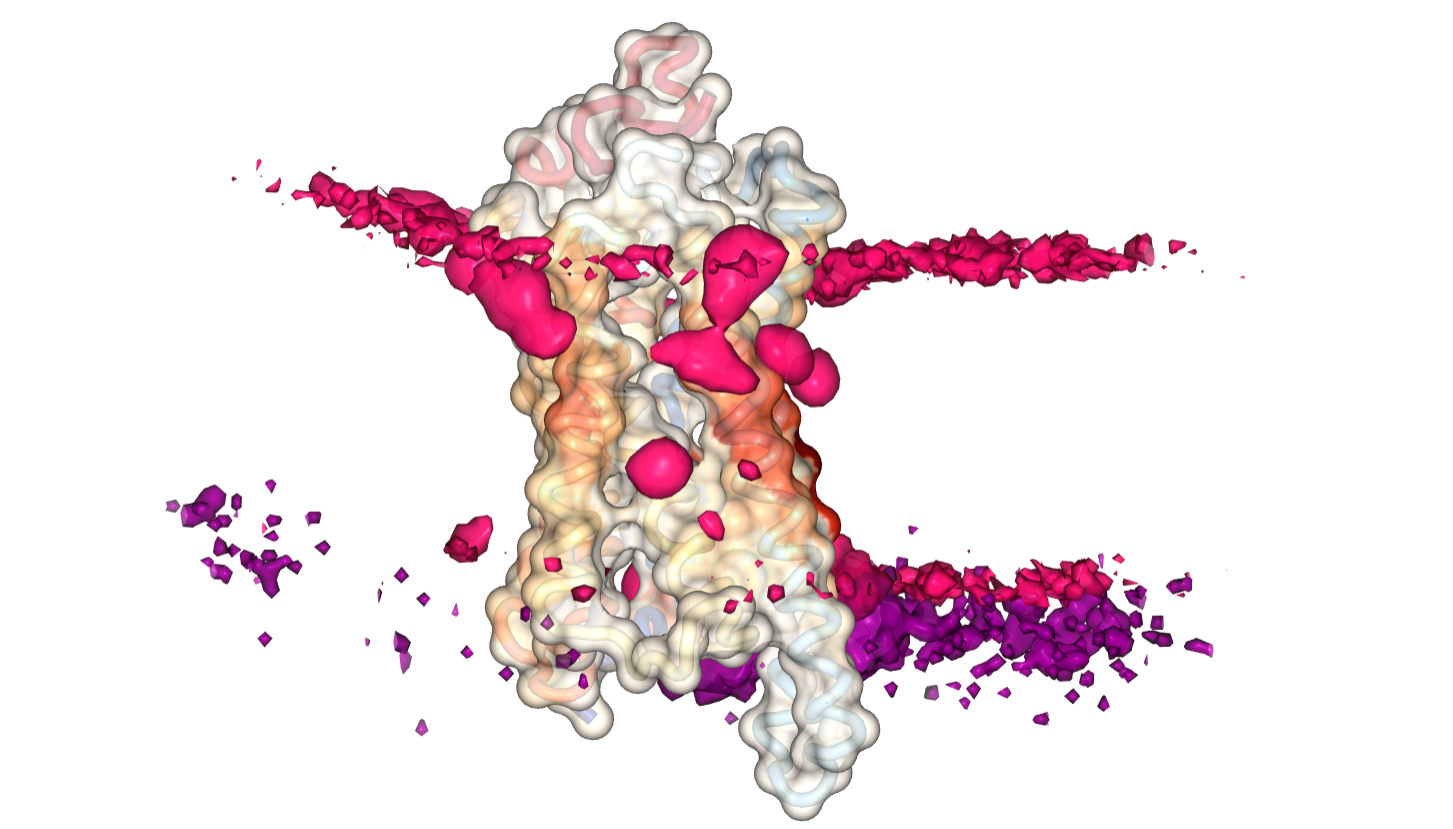
We use the ngl viewer to visualize the data in several representations. Proteins are shown in a transparent surface representation. You have the option to select the type of lipid you want to view. By clicking the "Show Contact Heatmap" button, the measured contacts between each residue of the protein and that particular lipid will be displayed/projected on the surface of the protein. The color gradient we use is white-to-red, meaning the darker and reder a residue is, the higher its interaction with the selected lipid. You can also switch between different measured metrics (again, researchers place varying importance to different metrics). Currently, you can view interactions as either the sum of all contacts or their longest duration. Support for other parameters will be added soon. In addition, you can choose to load the calculated 3D density distribution of the lipid. This is particularly useful when proteins are fixed in position during the simulation ( if they are not, then you can preprocess your trajectory to center the protein before uploading. ). If you load the density, please note that it may take some time until it is downloaded completely and displayed on your screen.
Using the control key and the mouse scroll wheel you can change the isolevels of the surfaces (either each lipid individually, or both of them simultaneously). The slice representation of the density is usefull because it eliminates the need to scroll and fine-tune the lipid surfaces. You can "slice" the 3D density of lipids in the x, y, z direction for each lipid, resulting in the familiar 2D surfaces. When viewing the slice representation, make sure to toggle off the density of that particular lipid, so that it does not interfere with the visualization.
If you are viewing your results for the Smoothened receptor, you will notice the bindig site with cholesterol in the extracellular side of helices II and III of the receptor, in particular if you view contacts measured by their relative duration.
Distance calculations
Another very important calculation that is very commonly done in lipid-protein interactions is measuring the distance between a residue and a lipid as a function of simulation time. This gives you a clear idea if the lipid is interacting specifically or not. To calculate the distance between a lipid and a residue, ProLint chooses a lipid based on its importance on the literature and results from contact analysis to measure its interaction distance with the best performing residues.
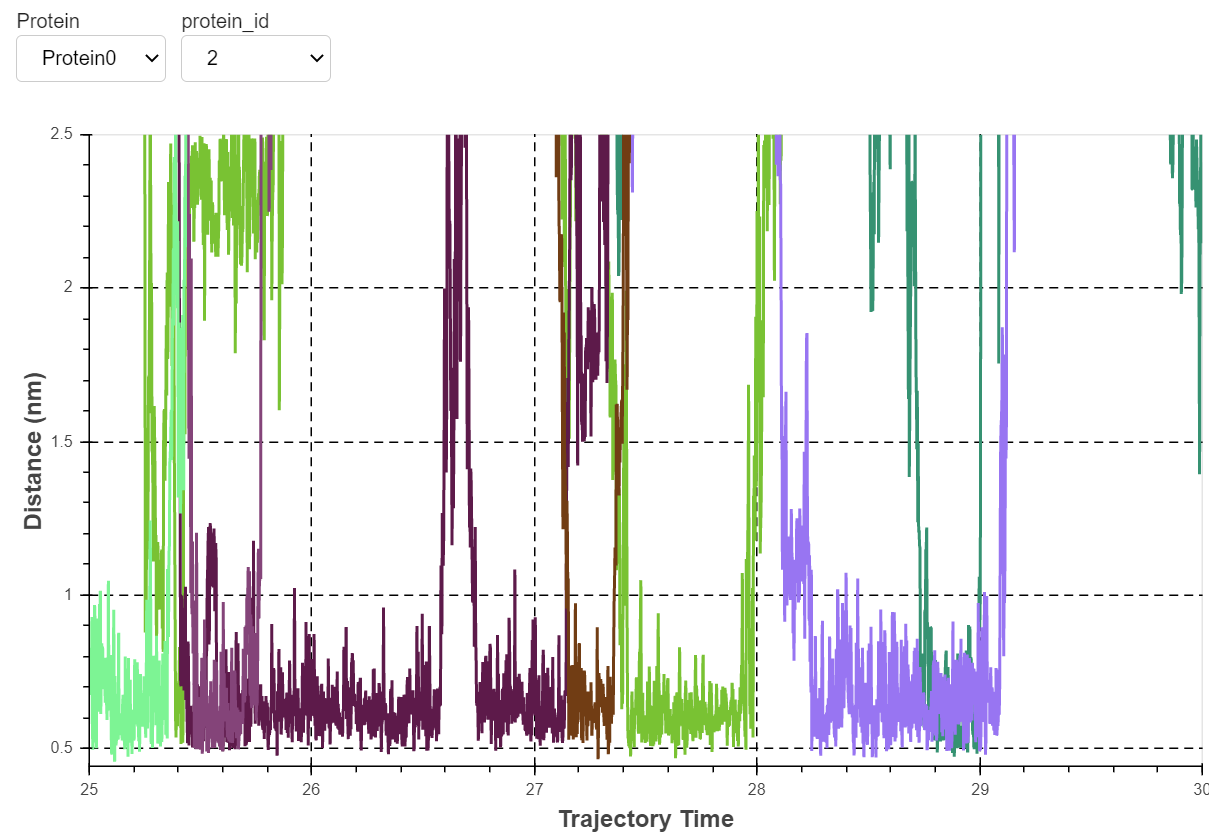
If you did the tutorial with the provided Smoothened data, you will see the tight interaction of cholesterol with several residues lining up helices II and III of the receptor. By changing the copy of the protein (there are four proteins in the system) you will notice how this interaction is reproducible on all copies of the receptor.
Graph Network
Network Graphs can be used to visualize relationships between member elements. We can, for instance, visualize interacting elements as nodes and their pairwise interactions as links (or vertices). We are completely free to choose the interacting elements and how we want to model their relationship. In the context of lipid-protein interactions, for example, nodes can be individual lipids, or groups of lipids, and we can visualize their interactions with protein residues by choosing appropriate links.
ProLint uses nodes to represent individual or groups of lipids. These lipid nodes are surrounded by 20 residue nodes, 1 for each possible amino acid present in the corresponding protein. Note that this application will fail if your system contains non-standard amino-acids. In that case, please contact us. We'll be happy to add support for non-canonical residues. Each of the residue nodes can be clicked, which will expand it to reveal the individual residues present in the protein being shown.
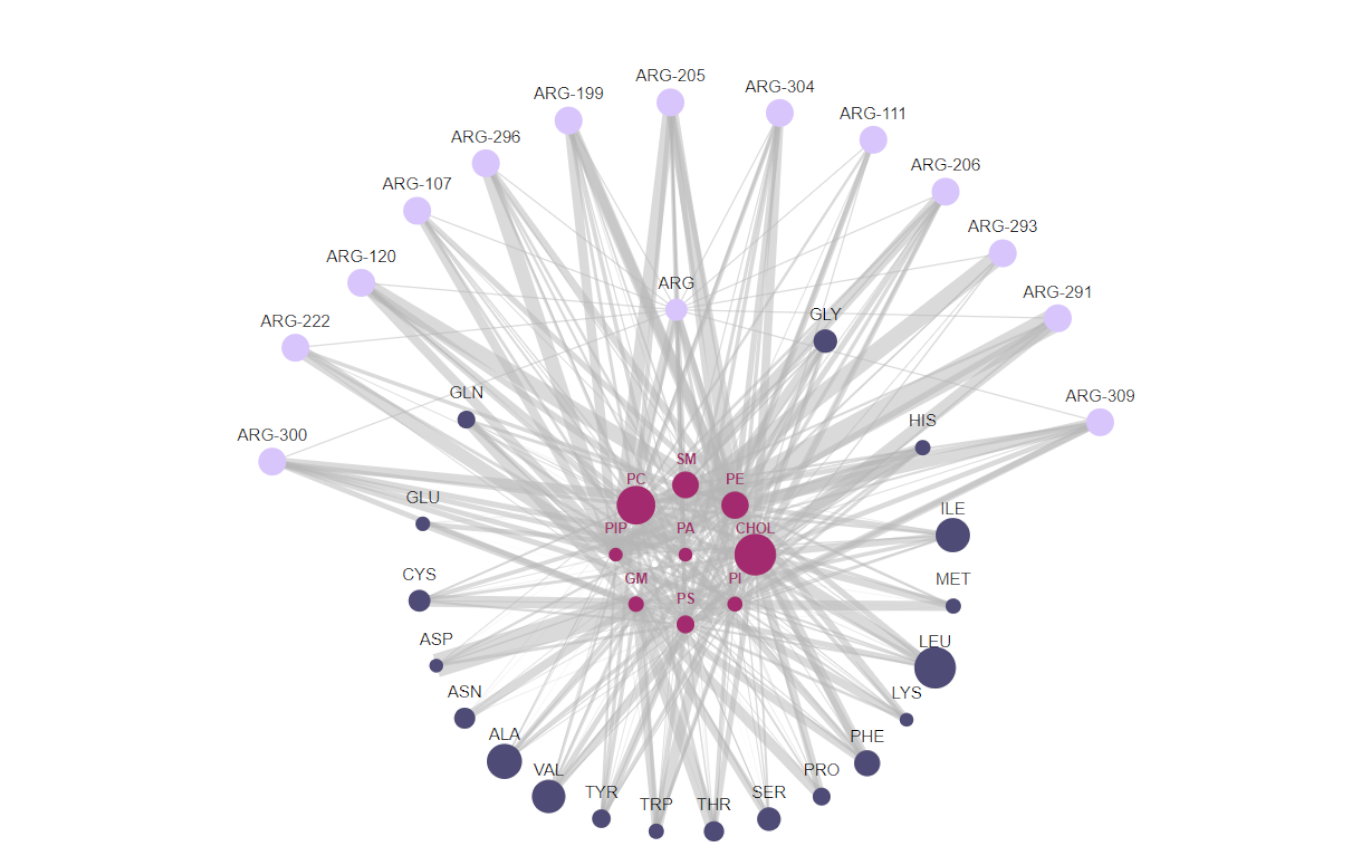
- The size of lipid nodes corresponds to the ratio of that particular lipid group in simulated systems.
- The size of residue nodes corresponds to the relative content of each residue in the protein being shown.
- Hovering the mouse over individual nodes will lower the visibility of all other nodes and links except those that share a connection with it.
- The connections between nodes represents lipid-protein contacts with the size of the links being a function of contact duration. If there is no link between two nodes that means that there was no interaction between them (or that interactions was really, really small) so, for clarity, we toggle their transparency to hide them from view.
- If a residue does not interact with any lipid at all (either because it is buried inside the protein core, or is distantly placed from the membrane) then it is not shown in the graph. This is done because the information these residues would provide by their inclusion is also available by their absence. This also ensures that large proteins do not overcrowd the graph with too many nodes and overburden the browser.
- The movement of the individual nodes and links is done by integrating their positions with a random seed. As such, sometime you may get an unexpected behaviour or observe the graph not as pliable as intended. If this happens, simply refresh the page.
- Lastly, if the number of nodes is really big, and depending on the machine you are using, you may observe some jittery node movement or flickering of the graph transparency.
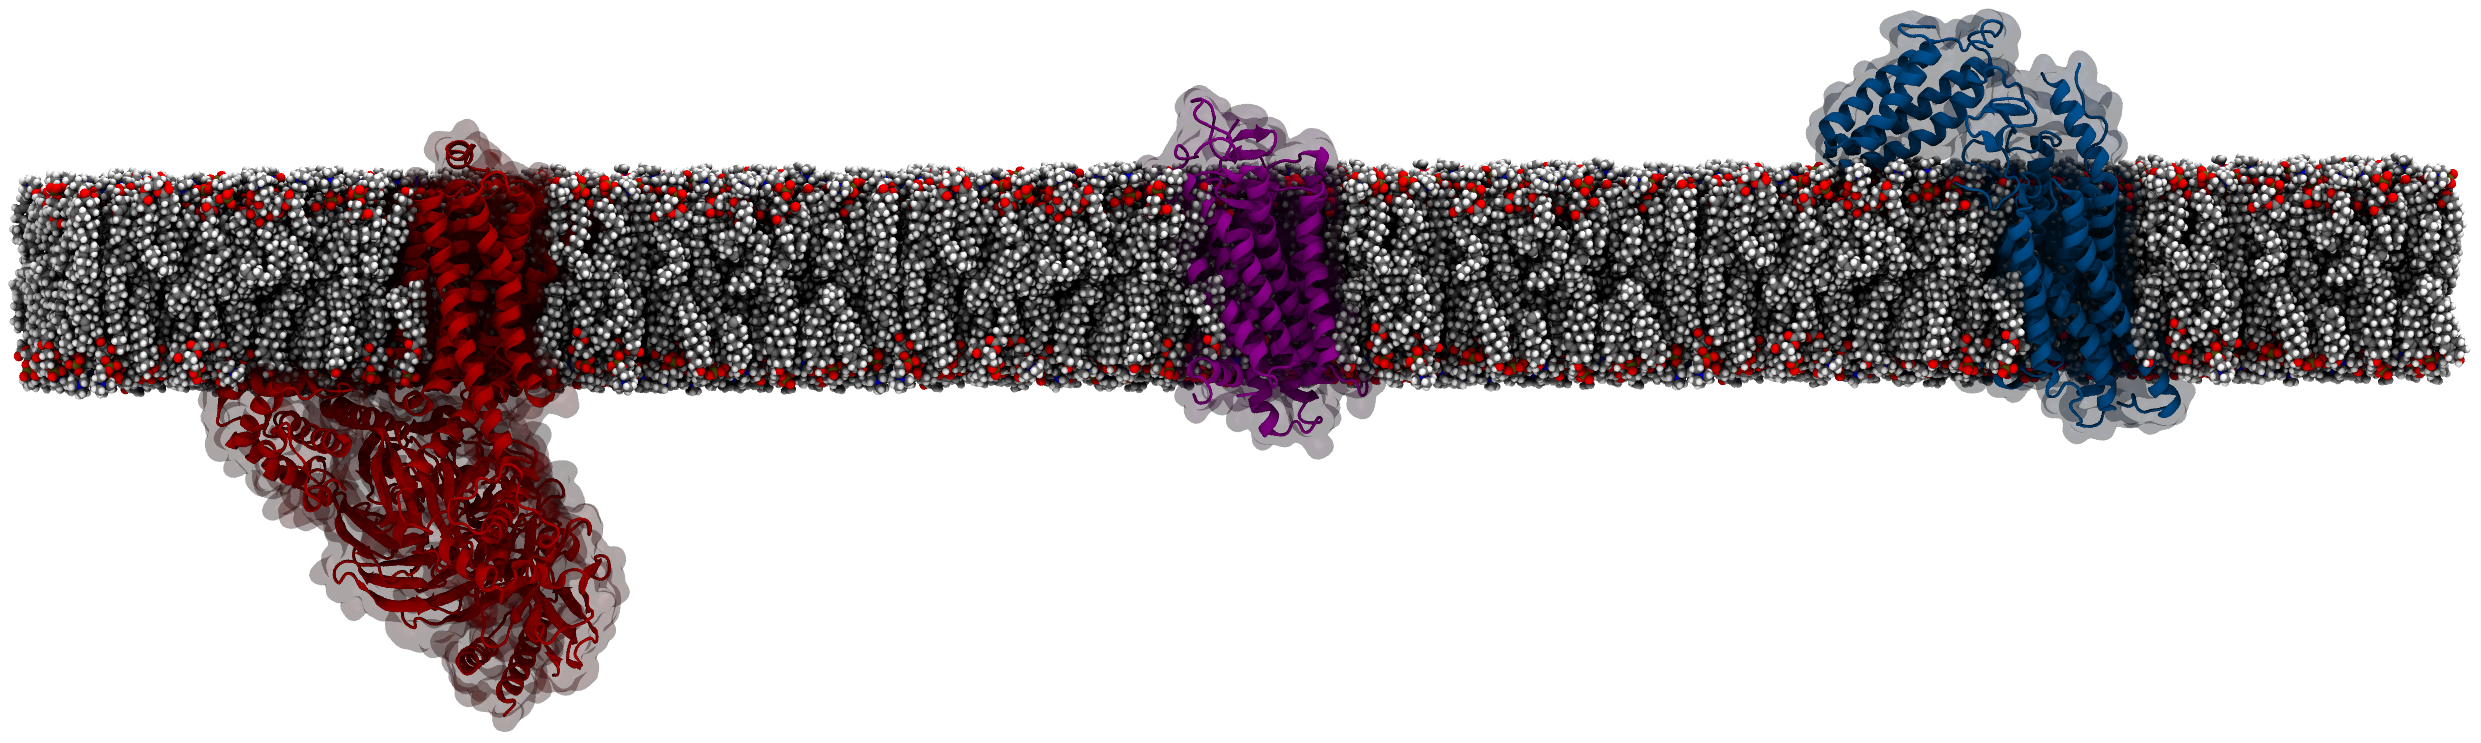
Membrane domain deformations
This application currently works only with Martini simulations. Analysis of membrane deformations as a result of embedded proteins in terms of lipid-protein interactions usually come secondary to the analysis of individual interactions of proteins with lipids, and they are even less frequently visualized in detail. The importance of the bulk lipid environment has, however, been noted many times in the literature, and in particular for GPCRs.
Using this application, we can visualize membrane thickness and curvature in great detail. The calculation method for the thickness and curvature profiles uses g_surf, a tool developed by our group and described in the following paper. As described there, g_surf uses three interpolated grid-surfaces (upper, middle, and lower) from which thickness and curvature profiles are calculated. Surface averages are calculated for the length of the trajectories. Using this application, you can analyze and view both Mean and Gaussian curvature as well as the thickness profile of the membrane model.
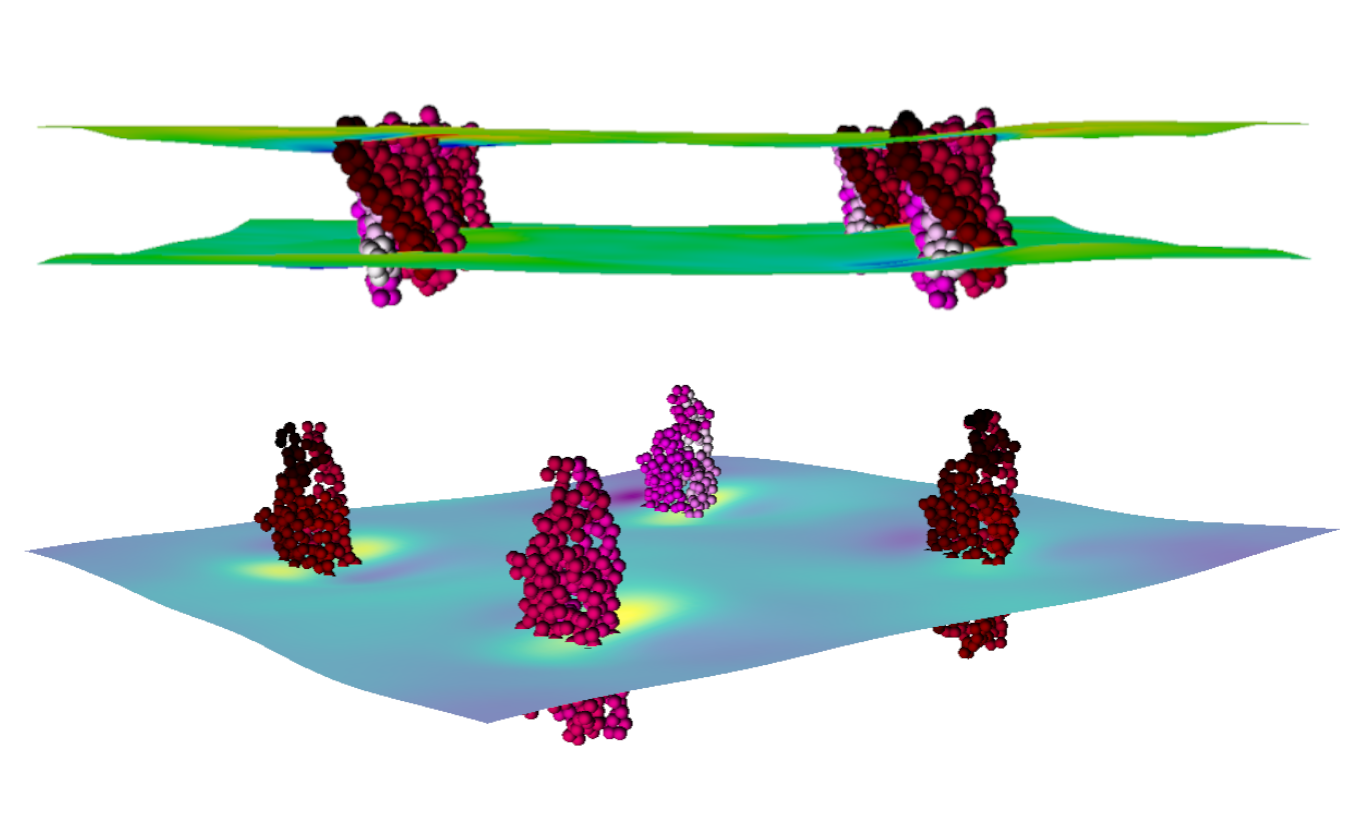
The application visualizes these results in an interactive format. You can visualize the results as either a point or surface mesh presentation. Each has its own options and parameters which can be tweaked to allow the user to select a part of the figure and control the detail of whatever aspect of it. We also show the position of embedded proteins as a point presentation with a coloring scheme that runs from black to red to pink to white. This makes it possible to clearly see which part of the protein is causing what deformation in the membrane.
Metric comparison
Because by default ProLint calculates several contact metrics, you may want to see how these parameters compare against each other. In particular, this becomes important when you have two or more residues that interact strongly with a lipid, and you want to compare their interactions against each other. ProLint provides a dedicated application to do this.
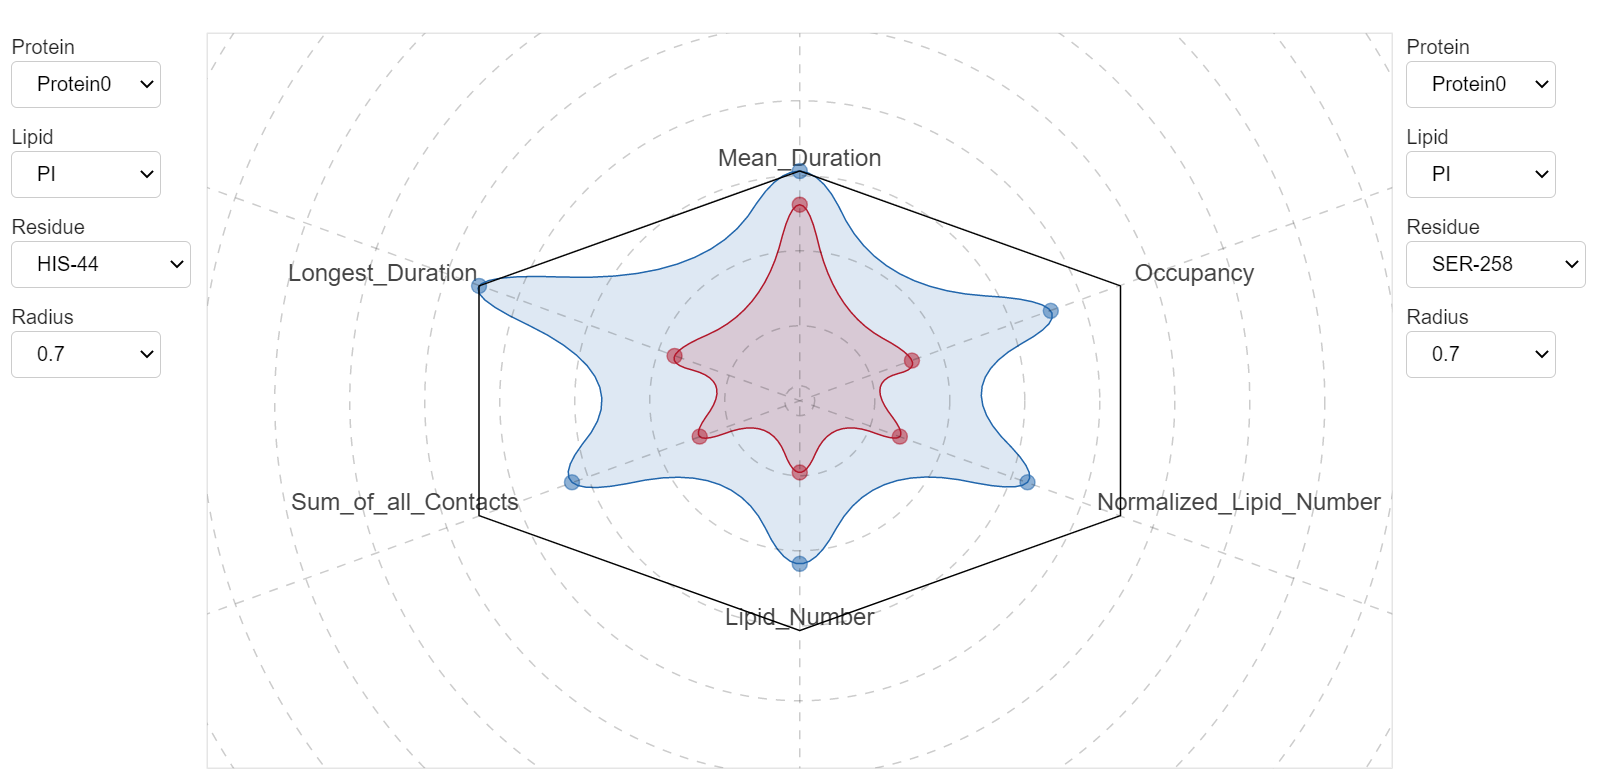
All contact metrics are normalized and presented using a radar plot. You can switch between different cutoff values and residues to see how they compare against each other.